Data-Driven Risk Management in USACE Construction Contracts
By Captain Robert B. Skinker and Captain Timothy J. Naudet
Article published on: January 1, 2024 in the Engineer 2024 Annual Issue
Read Time: < 10 mins
USACE Business Impact
On average, the U.S. Army Corps of Engineers (USACE) currently experiences a 60 percent time overrun and 7 percent budget overrun on construction contracts. These contract overruns cost the government years of construction potential and billions of dollars, adversely affecting training and readiness capabilities.
USACE collects information pertaining to all construction contracts through the Resident Management System (RMS), which tracks contract performance, including data on awards, execution, and closeouts of projects. The data-rich RMS is an untapped resource that represents an opportunity to analyze data to mitigate contract risk—the source of time and budget overrun.
Data-Driven Study
To enhance the ability to determine and predict the performance of projects, the authors, Captain Robert B. Skinker and Captain Timothy J. Naudet, performed a machine learning technical analysis of USACE construction contracts. The goal of the study was to use RMS to measure performance as a percentage of time and budget overrun and to ascertain how to effectively determine and predict project overrun—not to find ways to replace human analysts.
Data Collection and Organization
As a starting point, Captain Skinker and Captain Naudet partnered with USACE–Louisville District subject matter experts, who provided 307 completed military construction and multiple award task order contracts for analysis. The dates of all contracts were within the 10-year period from 2009 to 2019.
Next, the data set was pruned from 307 to 186 contracts (admittedly, a relatively small number) to avoid biases that could be introduced by unique or scenario-based situations. The data was then “cleaned” (organized for computation) since computers—much like humans—require strict data organization regimens. For example, whereas English-speaking people read from left to right, computers read data row by row. As a result of the initial data-cleaning efforts, it was recommended that the Louisville District alleviate the use of “free text” in favor of “vetted categorical variables,” thereby preventing the data corruption that occurs when users refer to one entity in multiple ways (“Fort Leonard Wood” versus “Fort Wood” or “FLW,” for example). This would establish a higher standard of “data governance” and streamline future projects. Once the data had been cleaned, it was ready to be analyzed for patterns of overrun.
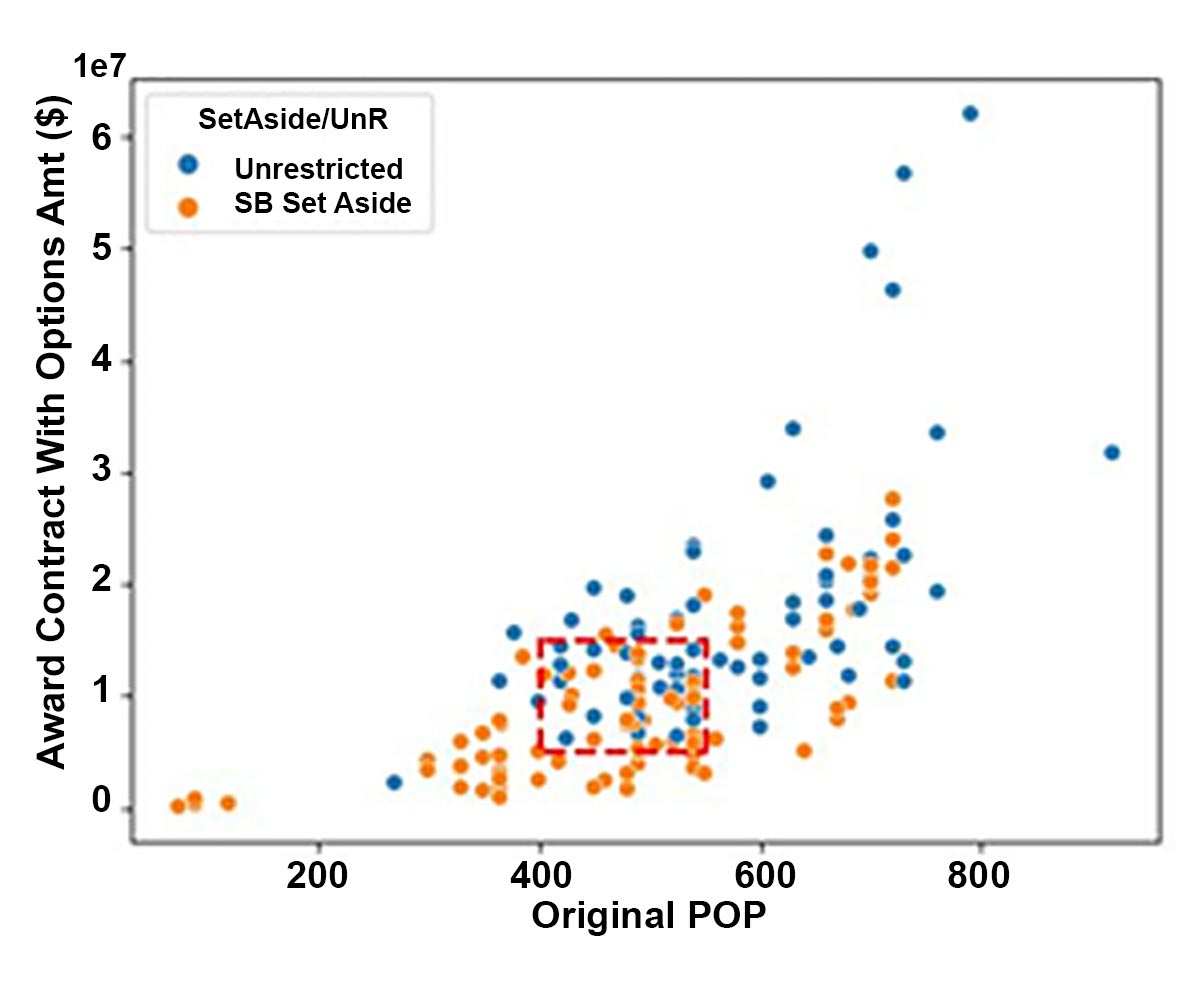
Figure 1. Initial contract cost (award) versus the original time (POP), separated by type (small business or unrestricted). The dotted red box delineates the region in which there is equal opportunity for the award of either type of contract.
Data Analysis and Conclusions
In the investigation of project overrun, the first variable analyzed was the effect of “small business” versus “unrestricted” contracts. A graph illustrating the relationship between the initial contract cost (award) and the original time (period of performance [POP]) for each of these types of contracts indicates that contracts for larger projects tend to be awarded as unrestricted (implying a preference for larger firms), while contracts for smaller projects tend to be “set aside” for small businesses (Figure 1). Such an imbalance in contract awards renders a direct comparison of all awards invalid; however, a “fair comparison window” (within which there is equal opportunity for the award of either type of contract) has been delineated by a dotted red box on the graph in Figure 1. When comparing contract awards within the fair comparison window, this study concluded that, on average, small businesses are just as effective at eliminating overruns as large firms are.
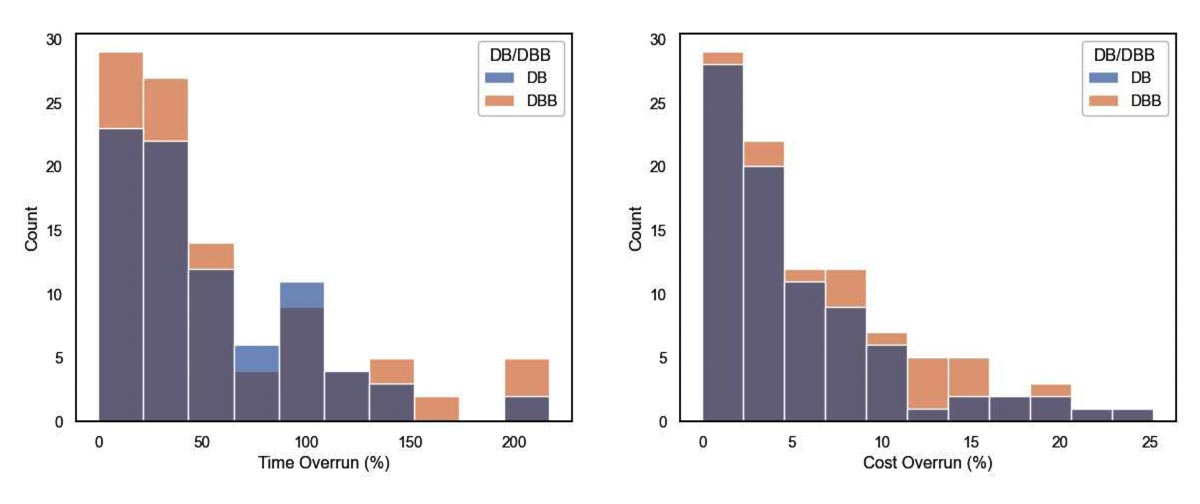
Figure 2. Histograms of counts of project procurement methods (DB versus DBB) separated into “buckets” based on overrun. The histogram on the left shows time overruns, and the histogram on the right shows cost overruns.
The second variable analyzed in the project overrun investigation was the effect of design-bid-build (DBB) versus design-build (DB) procurement methods. With the DBB procurement method, the design is completed by one firm and another firm bids on and builds the project; in contrast, with the DB procurement method, a single firm designs and builds the project. Histograms depicting cost and time overruns for each of these procurement methods are presented in Figure 2. Based on the data, it was determined that there is only a slight difference in cost overrun and no statistically significant difference in time overrun between the two procurement methods. The study concluded that for eliminating overrun, DB is the more effective of the two procurement strategies—but only slightly so.
The next aspect of project overrun that was analyzed was the stability of both time and cost overrun by year. As can be seen in Figure 3, there were relative spikes in time overrun for contracts awarded in 2012 and 2014 and an even more significant time overrun spike for contracts awarded between 2017 and 2019. These time overruns appear to be closely related to environmental variables, which can include laws, regulations, and weather. The spike in time overrun for contracts awarded from 2017 to 2019 is likely due to the administrative effects of the COVID-19 pandemic. Unfortunately, the data set does not contain information about environmental variables that may have affected time overrun of annual projects; it is suggested that SMEs be consulted with regard to the causes of the observed environmental effects. It is also recommended that data governance be restructured to address this information shortfall in the future. The study concluded that when analyzing overrun stability by year, efforts should be focused on time overrun, as cost overrun tends to be predictably stable.
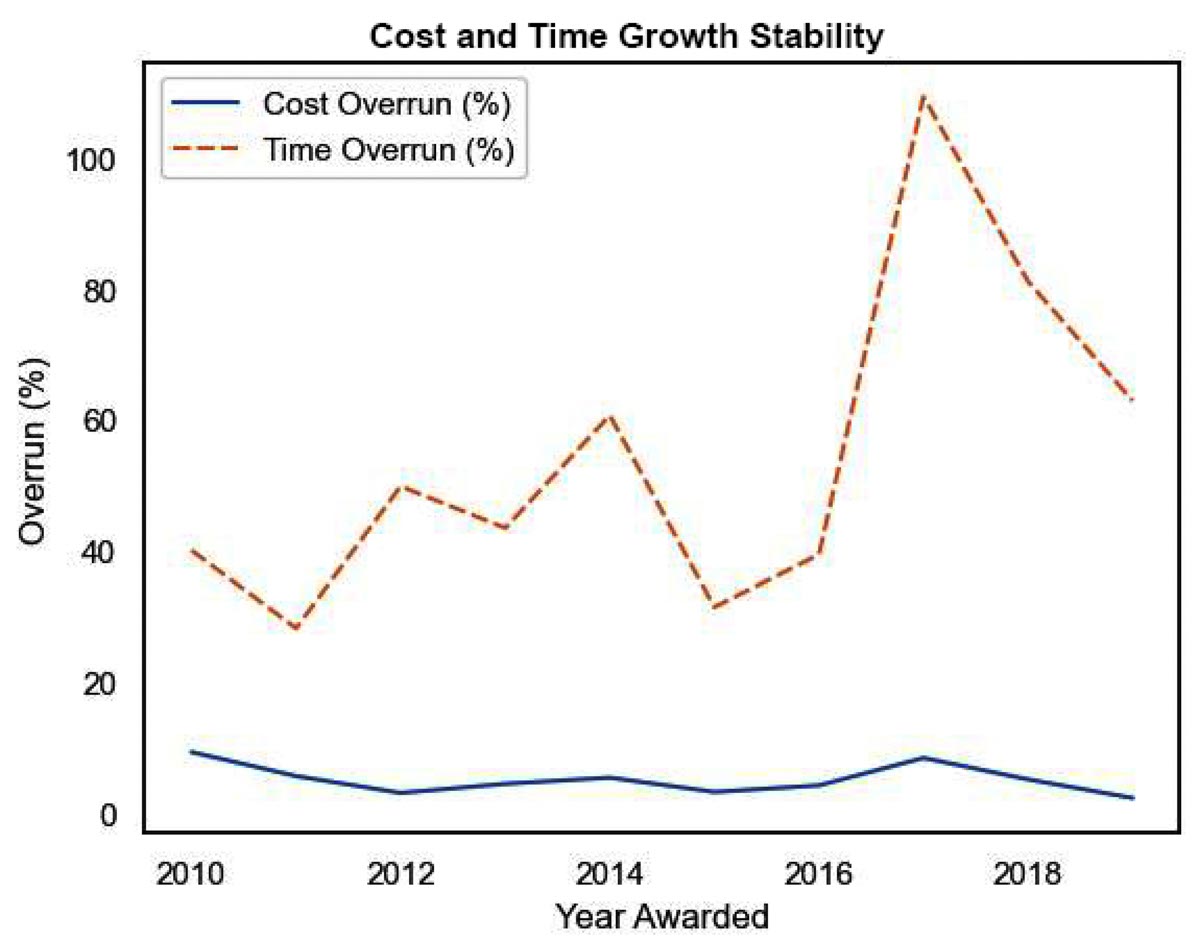
Figure 3. This plot shows the stability of cost and time overrun for the 10 years for which contracts were analyzed.
Another project overrun variable that was analyzed in this study was that of geography. Figure 4 contains a heat map showing the average project overrun by state across the United States, with brighter colors indicating states with higher overruns. Based on the data, the North Atlantic Region—comprised of New York, Massachusetts, New Jersey, and New Hampshire—has statistically higher overruns than other regions of the country. It is presumed that the time and cost overruns associated with this region are due to environmental variables; however, the lack of environmental information in the data set requires speculation.
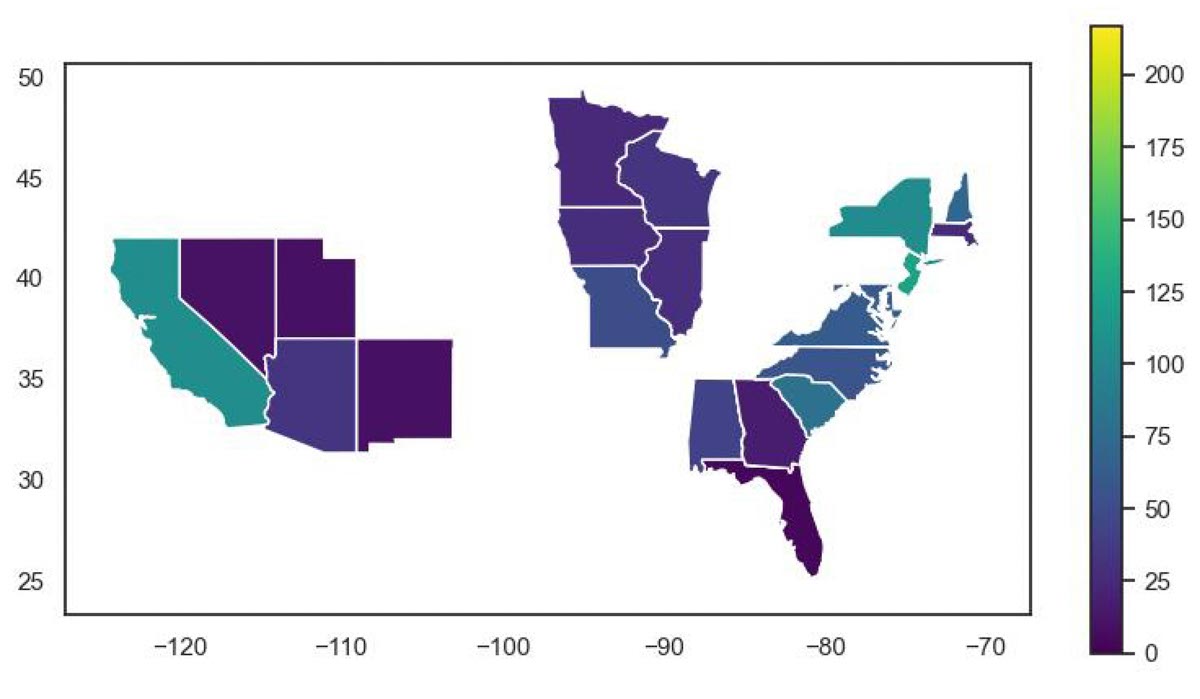
Figure 4. Map of the United States where the colors indicate the average overrun percentage observed in projects contained within those states.
The final aspect analyzed in the project overrun study was the relationship between overrun and the two variables of initial contract cost (award) and original time (POP). Contracts were categorized as “low overrun” (if in the lower 50 percent of contract overruns) or “high overrun” (if in the upper 50 percent of contract overruns) and plotted on the graph on the right in Figure 5—with low-overrun contracts depicted in blue and high-overrun contracts depicted in orange. The graph on the right, therefore, represents real-world data (the ground truth). Upon analysis of this data, a predictive relationship between contract overruns and the two variables (initial cost and original time) was identified; that relationship is defined by the following “Golden Ratio” equation:
Budget overrun = [$10 million x (d/350)] - $4 million;
d ∈ {200 . . . 700} days
(which is read as: budget overrun is equal to $10 million multiplied by d/350, where d is the number of days and is an integer inclusively contained between 200 and 700). The plot on the left in Figure 5 is a graphic representation of the linear model, again with low-overrun contracts depicted in blue and high-overrun contracts depicted in orange. The graph demonstrates that for projects with original POPs of 200 to 720 days, contracts with lower initial awards or shorter POPs are more likely to result in overruns. When applied at scale, the model can be used (with 60 percent accuracy) to predict cost and time overruns of contracts and determine whether a particular project is likely to be high-risk (categorized as high-overrun). This is the most significant contribution of the study. It is recommended that the Golden Ratio be applied to future contracts and that, if necessary, contractor adjustments be requested prior to USACE acceptance. The savings could potentially be significant; a savings of 10 percent across all contracts for a given year equates to 10 percent of the budget that can be used for other projects.
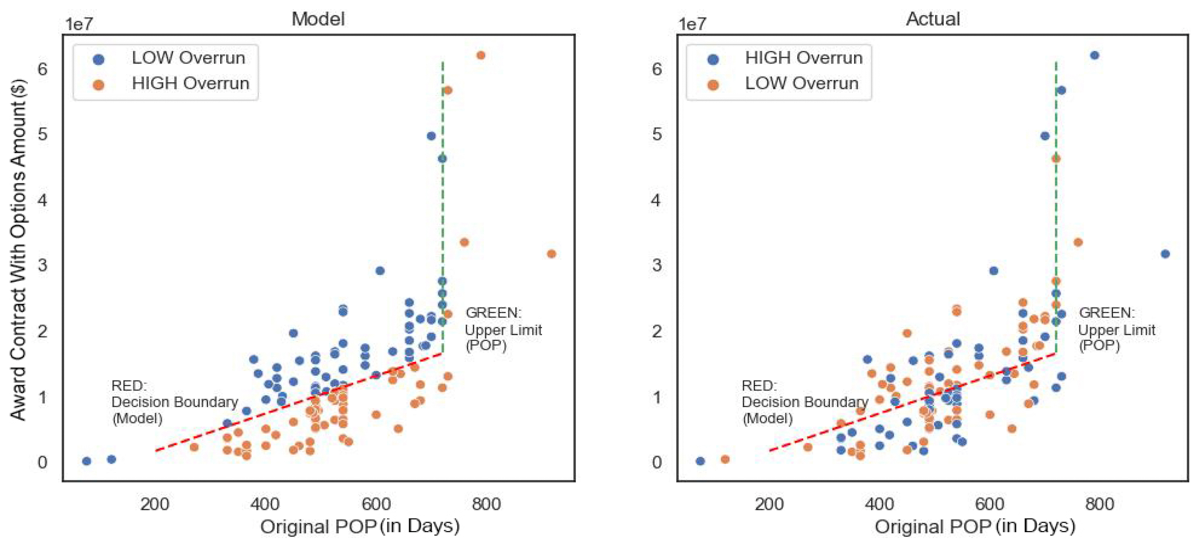
Figure 5. The graph on the right shows the “real-world” (actual ground truth, as recorded by humans) overrun classification of the contracts in relation to the initial budget amount (designated as “Award Contract With Options Amount”) and the original POP. The graph on the left depicts the linear model developed to predict the overrun of a contract based on its initial budget amount and original POP. The disbursement of low-overrun and high-overrun contracts is uniform in the graph on the left; contracts above the Golden Ratio line (depicted in blue) are under the average overrun, and contracts below the Golden Ratio line (depicted in orange) are above the average overrun.
Summary of Results
The statistically significant findings of the USACE construction contract study include the following:
- Contracts awarded to small businesses perform in a manner similar to those of large firms.
- The DB procurement process is only slightly more effective than the DBB process at eliminating overrun.
- Environmental variables undoubtedly affect time overrun; however, those variables are not currently captured in the project data set.
- There is a significant relationship between time overrun and the year of contract award, while cost overrun is independent of the year of contract award.
- The North Atlantic Region of the United States experiences statistically higher overruns than other regions of the country.
- The Golden Ratio can serve as a tool to predict cost and time overruns of certain projects with 60 percent accuracy.
These findings should help enable USACE professionals to make data-driven decisions in order to mitigate project overrun; parties who are interested in obtaining a more complete report of the study may reach out to the authors of this article.
The Way Ahead
The machine learning technical analysis of USACE construction contracts is aligned with the recently distributed “Message to the Army Team”—primarily with the continuous transformation policy, as the study meets the criterion of integrating technology as soon as it is useful. However, future goals include obtaining additional data and standardizing data governance, thereby enabling dramatic improvements to predictive model performance. Other USACE districts are encouraged to contact the authors of this article to become involved in future studies.
Notes
Reference
Stew Magnuson, “AUSA News: Army Leader Signals Change in ‘Big Six’ Modernization Priorities,” National Defense, 11 October 2023.
Authors
Captain Skinker is the commander of the 50th Mutli-Role Bridge Company, 5th Engineer Battalion, Fort Leonard Wood, Missouri. He holds a bachelor of science degree in mechani
cal engineering from Virginia Tech. He completed work on the study described in this article as a requirement for obtaining a master’s degree in information system management–business intelligence and data analytics from Carnegie Mellon University, Pittsburg, Pennsylvania. Captain Skinker can be reached by e-mail at robert.j.skinker.mil@army.mil or by telephone at 610-533-4380.
Captain Naudet is a data scientist at the U.S. Army Artificial Intelligence Integration Center, Army Futures Command, Pittsburg. He holds a bachelor of science degree in chemistry from the U.S. Military Academy – West Point, New York. He completed work on the study described in this article as a re-quirement for obtaining a master’s degree in information system management–business intelligence and data analytics from Carnegie Mellon University. Captain Naudet can be reached by e-mail at timothy.j.naudet.mil@army.mil or by telephone at 818-414-0815.